
BirdLife International and BirdLife Australia launched our Avian Sensitivity Tool for Energy Planning (AVISTEP) at the Australasian Ornithological Conference in Boorloo/Perth.
Today, AVISTEP was launched in Australia, providing government planners and the renewable energy sector with detailed interactive maps showing where birds are most at risk from energy infrastructure on land and at sea. The new maps are the result of a collaboration between BirdLife International’s Science Team, and BirdLife Australia. The team worked with many of the country’s leading ornithologists and researchers to make this online tool a game-changing reality that shows where birds would be affected by windfarms, solar facilities and powerlines.
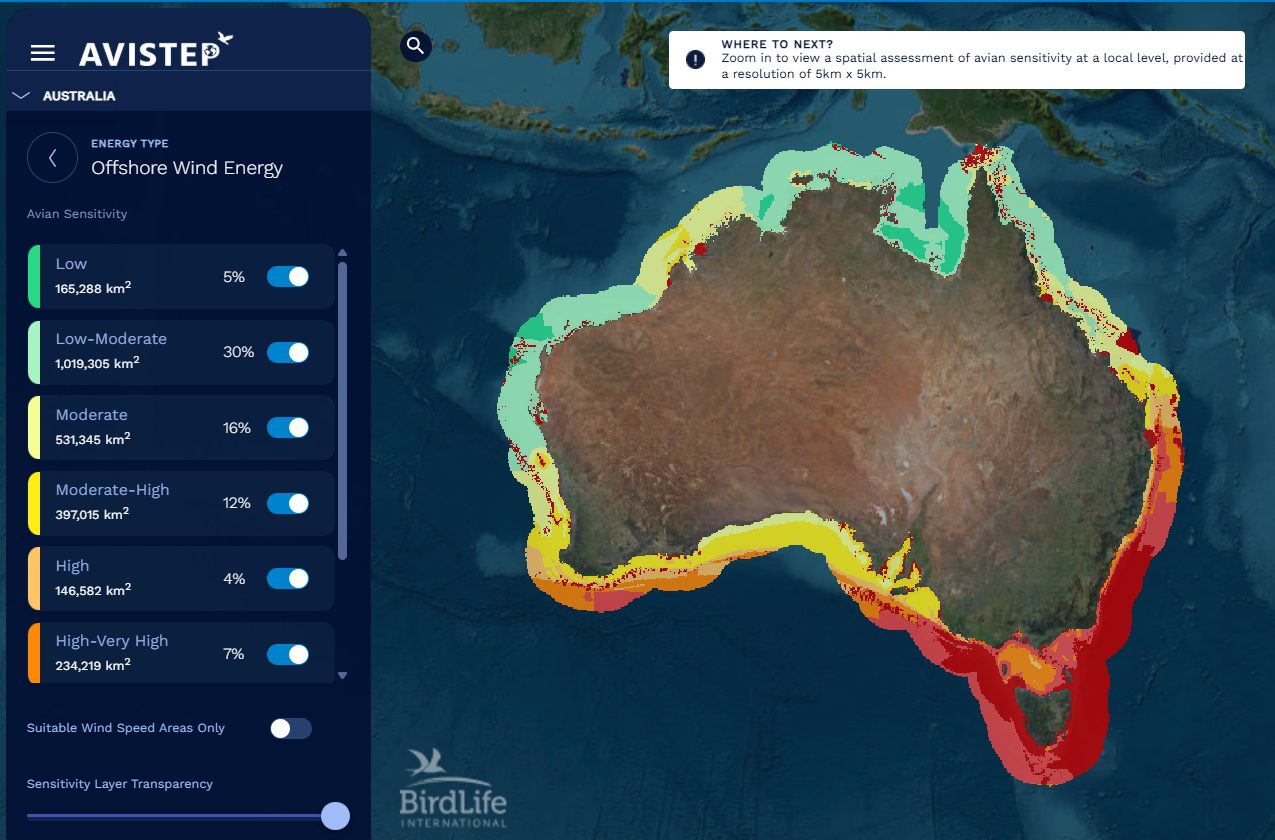
With Australia aiming to achieve 82% of its electricity generation from renewable sources by 2030, it has never been more urgent to ensure that this transition keeps local wildlife in mind. This push will require a major expansion of the current wind and solar developments in the country, as well as an associated increase in pylons and cables. Birds are particularly affected by energy infrastructure, so planning around their needs is crucial. Some species are particularly vulnerable to collision with wind turbines and powerlines, while others can be displaced from their preferred habitats or have their migration pathways interrupted by the development of new installations.
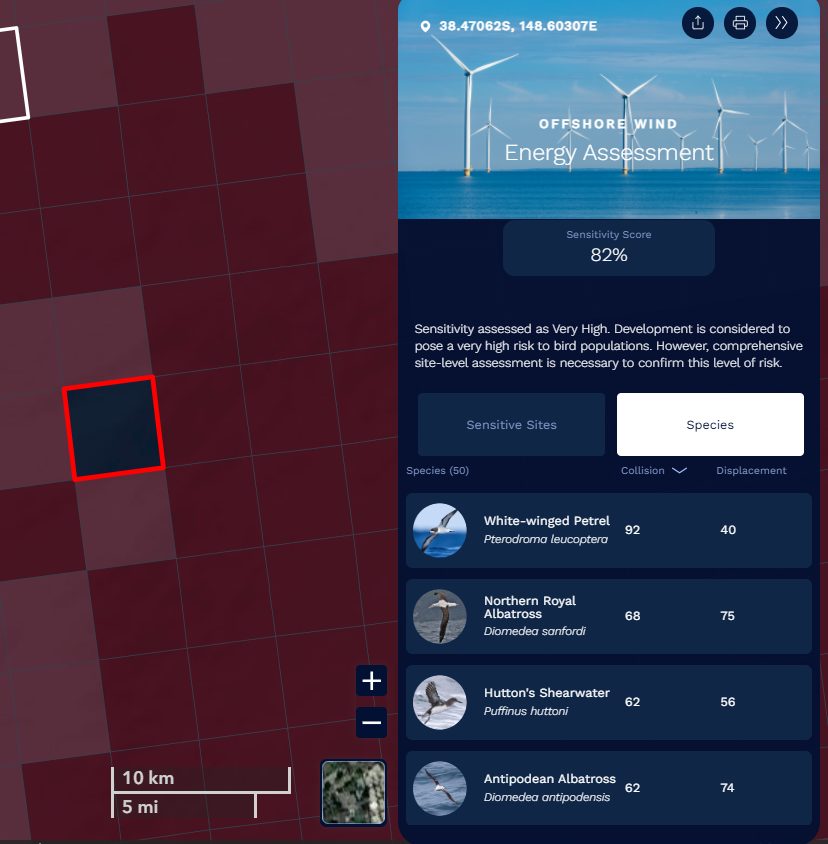
AVISTEP’s interactive maps provide a clear indication of where the sensitive areas are in Australia for onshore and offshore wind farms, solar facilities and powerlines. The maps are freely available, so anyone can see where wind and solar resources are, how badly affected an area’s birds are by each type of energy infrastructure and the species found at these sites.
Tris Allinson, Senior Conservation Scientist at BirdLife International and the project lead says: “AVISTEP shows us where birds and habitats sensitive to renewable energy are. With this information, it becomes much easier to avoid harming them as we continue to expand the infrastructure needed to transition towards a sustainable future.”
Kate Millar, CEO of BirdLife Australia, highlights the input of birders central to the work: “Australia is home to an incredible diversity of birds, many of which are found nowhere else. BirdLife Australia supports a rapid transition to renewable energy using the best available evidence to make smart site choices to protect birds and nature. The AVISTEP tool, which uses high-quality data including that collected by thousands of BirdLife Australia’s citizen scientists, empowers industry, decision-makers and communities to work together on the urgent transition to renewable energy while ensuring we continue to put threatened birds on a path to recovery.”
Jarrod Pittson, Group Manager Environment & Closure at Fortescue, who made the project possible thanks to their generous support, says: “Fortescue is proud to partner with BirdLife to support the development of AVISTEP, helping ensure renewable energy projects are delivered in the right locations and not at the expense of biodiversity. This partnership reflects our commitment to protecting Australia’s unique ecosystems and the vulnerable bird species that play such an important role in them.”
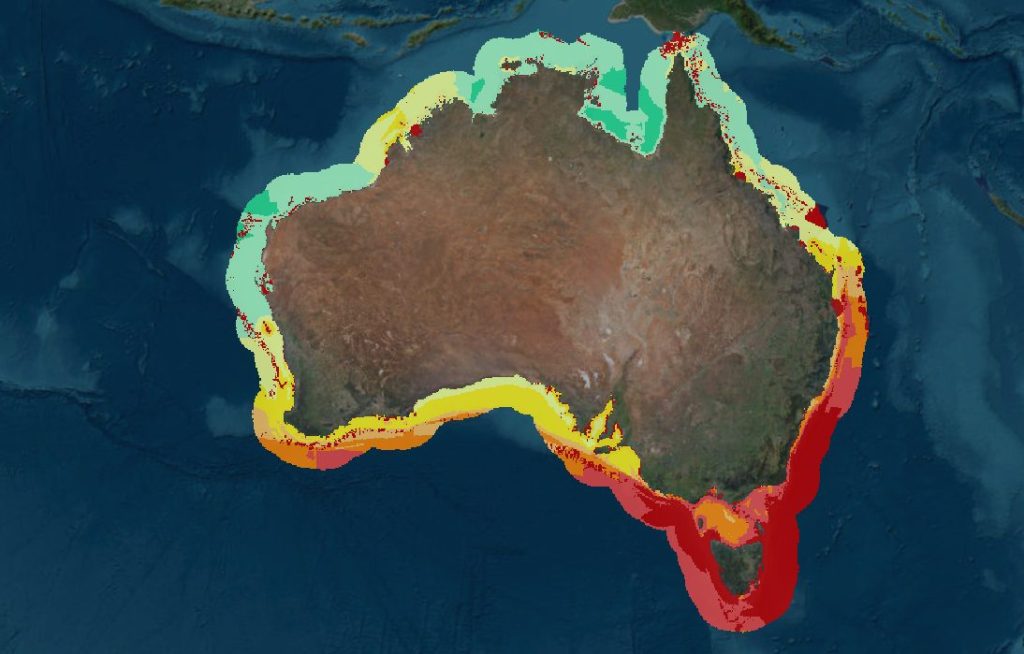
Focus on offshore
The offshore wind sensitivity map used data contributed to the Seabird Tracking Database to inform distribution maps for seabirds. While tracking data provide valuable information about bird movements, they cover a small sample individuals and populations, so we used a variety of data sources and analytical techniques to build the maps.
First, we created a list of regularly occurring species in our area of interested and assigned sensitivity scores based on collision, displacement and conservation parameters. We then produced spatial layers for all species and combined them using the sensitivity score as a weighting. For all-year distributions we used tracking data to corroborate or edit range maps and core areas. For breeding species, we used a database of colony locations and population sizes to model density at sea, and we used tracking data to refine the models where appropriate.
We used species distribution layers in combination with 5km buffers around all seabird colonies, Key Biodiversity Areas, terrestrial bird migration, submarine canyons, selected seamounts, seagrass meadows, coral reefs, mangroves, Ramsar sites and Marine Protected Areas.
For more information about the datasets and methods please see the AVISTEP Manual.